

The Position Sizing Framework for Wheel Traders
The 5–10% rule, cash reserve math, sector limits, and the stress test that separates traders who compound from traders who blow up.

A trader who picks mediocre strikes on properly sized positions builds wealth over decades.
A trader who picks perfect strikes on oversized positions eventually blows up.
The math is unforgiving.
This piece covers the position sizing framework that keeps Wheel accounts alive:
The 5–10% rule and the math behind it
Portfolio allocation: how much to deploy, how much to hold back
Sector concentration limits that prevent correlated blowups
The stress test every Wheel trader should run before opening positions
Position sizing is the foundation. Get it right and mistakes stay survivable. Get it wrong and nothing else matters.
How much should a Wheel trader risk per position?
No single Wheel position should exceed 10% of total portfolio. Conservative traders cap it at 5%.
Position size is measured by collateral held — the full purchase amount the broker locks up when a cash-secured put is sold.
A $50 strike locks up $5,000. A $150 strike locks up $15,000. On a $100,000 portfolio, the 10% cap means $10,000 maximum collateral per position.
Selling a cash-secured put is an agreement to buy 100 shares at the strike if the stock falls. The broker holds the full purchase amount as collateral until the option expires or the position closes.
That collateral is the position size — the capital exposed if the stock drops and shares get assigned below the strike.
Why does the 5-10% rule work?
Stocks drop 30-50% more often than people expect. Earnings misses. Sector rotations. Broad market selloffs. These are regular features of equity markets, not rare events.
Every position will eventually sit through a major decline. The only question is whether the decline damages the portfolio or destroys it.
Run the scenarios on a $100,000 portfolio:
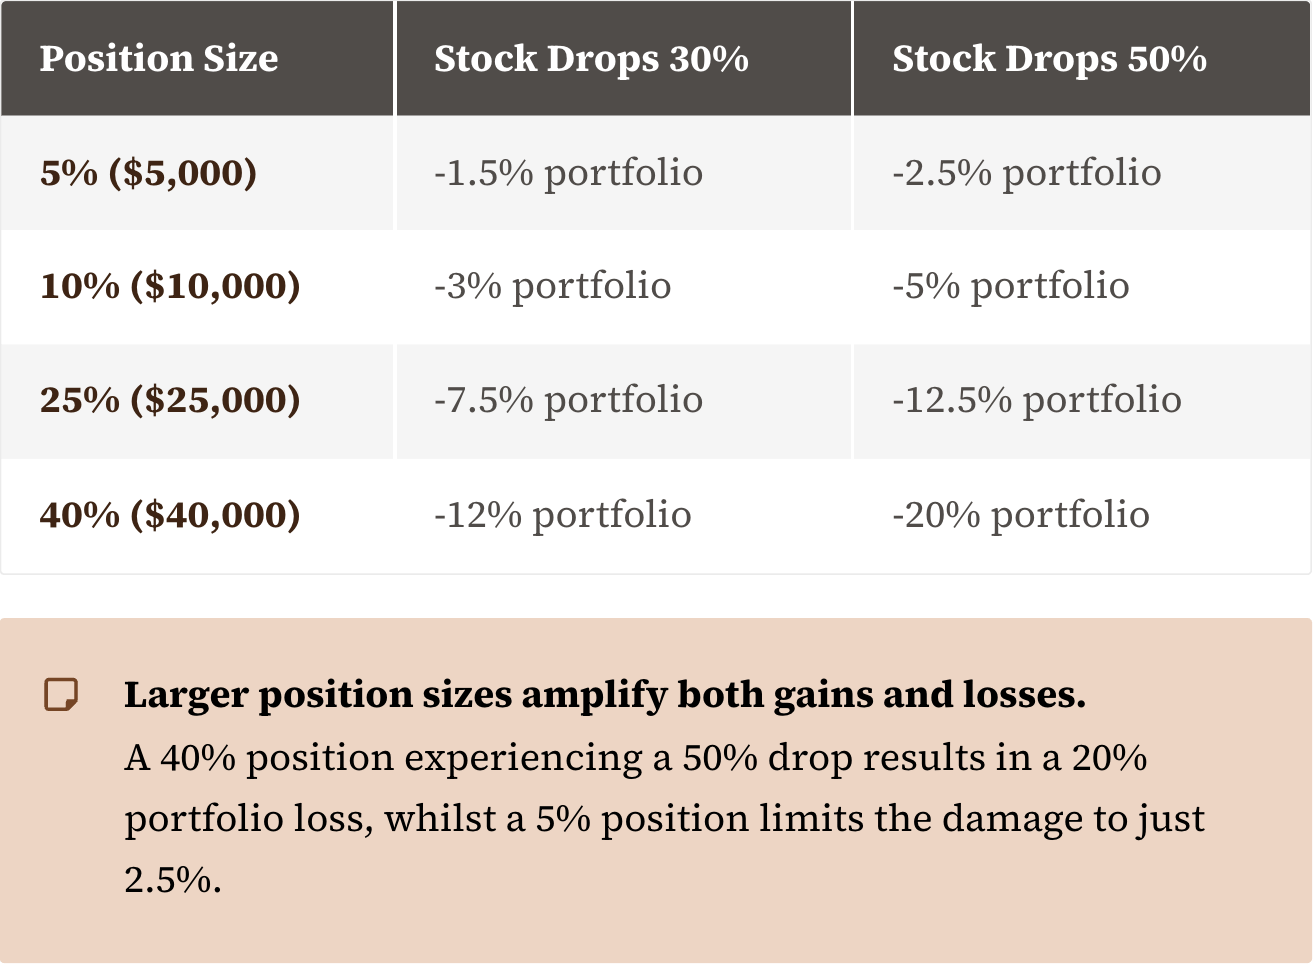
At 5-10% sizing, a catastrophic single-stock event costs a bad month. At 25-40% sizing, the same event erases a year of gains — or triggers panic decisions that compound the damage.
What does 5-10% look like on smaller accounts?
On a $100,000 portfolio, a 10% cap means $10,000 collateral per position. One contract on a $100 stock. Two contracts on a $50 stock.
On a $50,000 portfolio, the cap is $5,000. That limits single-contract positions to stocks under $50.
Smaller accounts face real constraints here.
Portfolio Allocation
Position sizing governs individual trades. Portfolio allocation governs the whole picture — how much capital is actively working versus held in reserve.
How much capital should be deployed at once?
The framework:
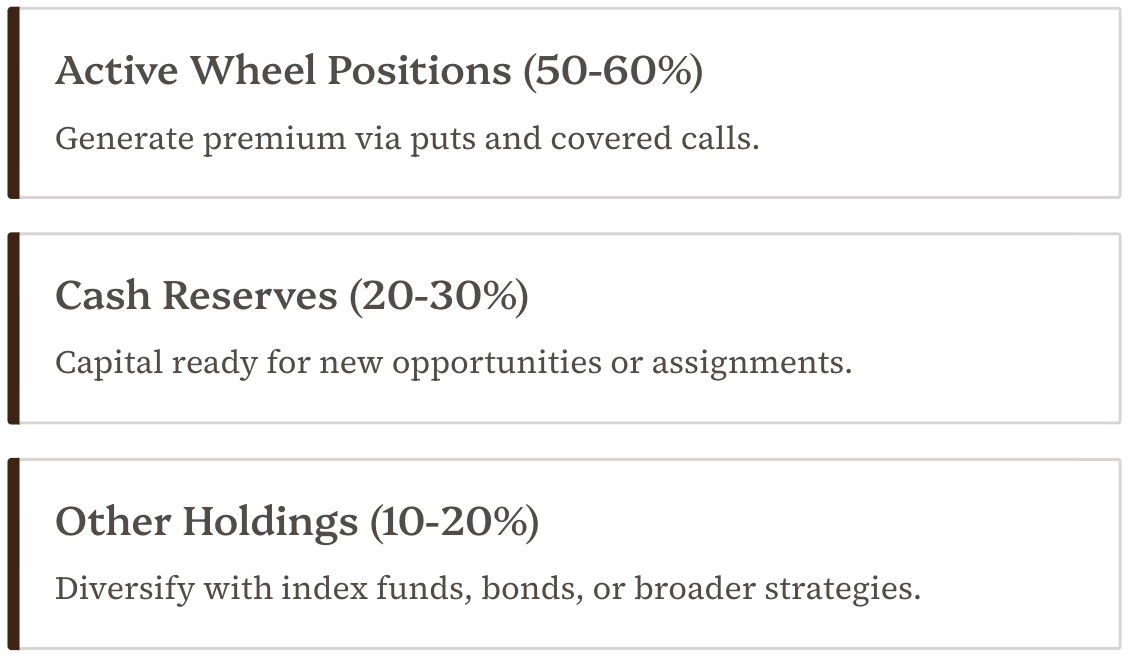
This is mechanical necessity. Not conservatism for its own sake.
Why keep 20-30% in cash?
Assignment can happen at any time. If three positions get assigned in the same week — which happens during market selloffs, exactly when stocks are cheapest — the capital has to exist to take delivery.
Without reserves, the choice is bad: close positions at a loss to free up capital, or fail to meet assignment and trigger a margin call. Both are preventable with proper allocation.
Cash reserves also enable action when opportunities appear. Volatility spikes create fat premiums. Sector selloffs put quality stocks on sale. Traders who profit from these moments are the ones with dry powder available.
The Deployment Calculation
On a $100,000 portfolio with 60% maximum deployment:
Total deployable capital: $60,000
At 10% max per position: 6 positions maximum
At 8% per position: 7-8 positions
At 5% per position: 12 positions
Most Wheel traders run 4-8 active positions. Fewer concentrates risk. More becomes difficult to manage alongside a full-time job.
The remaining 40% isn’t idle. Treasury bills or a money market fund pay around 3.5% while maintaining liquidity. That cash is working — just differently.
How much sector exposure is too much?
The 5-10% rule can be followed perfectly and still produce a blowup.
A trader runs six positions, each at 8% of portfolio. Textbook sizing.
But all six are tech stocks: AAPL, MSFT, NVDA, AMD, GOOGL, META. When the sector sells off 20% on rate hike fears, all six positions move against the account simultaneously.
That is one sector bet at 48% of portfolio. Not six positions.
Correlation is the hidden risk in position sizing.
Stocks in the same sector, same market cap range, or same factor exposure tend to move together. Diversification across tickers means nothing when those tickers all respond to the same forces.
The Limits
No more than 25% of portfolio in any single sector
No more than 2-3 positions in the same sector at once
Spread across at least 3-4 sectors when fully deployed
On a $100,000 portfolio running six positions:
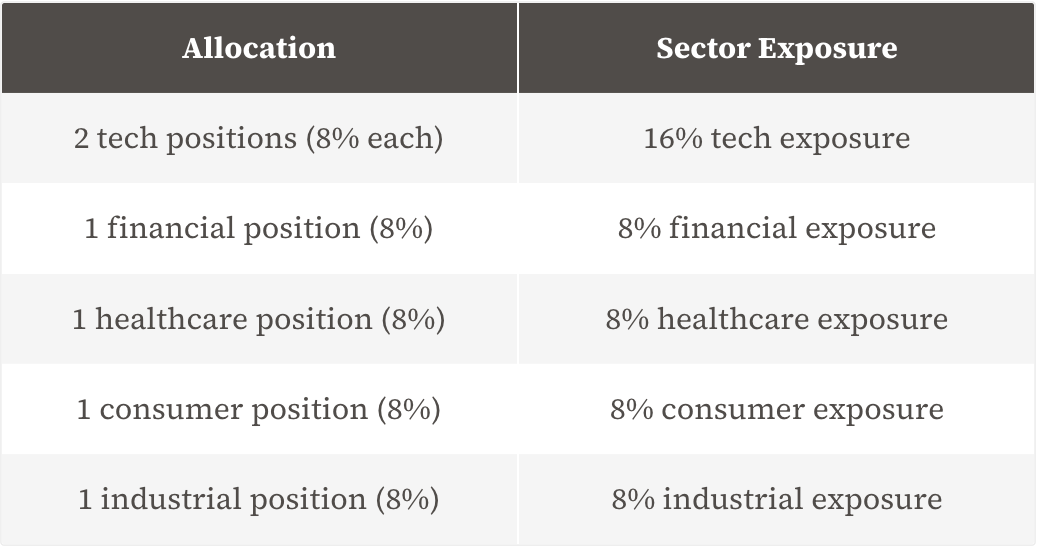
Now a 20% tech selloff costs 3.2% of portfolio instead of 9.6%. The difference between a minor setback and a major drawdown.
Correlation Beyond Sectors
Sector labels don’t capture everything.
Growth stocks move together regardless of sector
High-beta names amplify market swings in unison
Dividend stocks often correlate during rate changes
Small caps behave differently than large caps
A portfolio of TSLA, SHOP, SQ, and ROKU spans four sectors — but they’re all high-multiple growth names. They sell off together when growth falls out of favor.
The better question is what would make these positions move together, not what sector classification they carry.
The “Everything Goes Wrong” Stress Test
Before opening any new position, run this scenario: every put sold gets assigned simultaneously.
Can the account handle it?
This isn’t paranoia. Market selloffs trigger correlated assignments. The same fear that drops Stock A below its strike also drops Stocks B, C, and D below theirs. Assignment clusters are a feature of market stress, not a freak occurrence.
The Test
Add up the collateral requirements for all open puts. That’s the cash required if every position got assigned this week.
Example on a $100,000 portfolio:
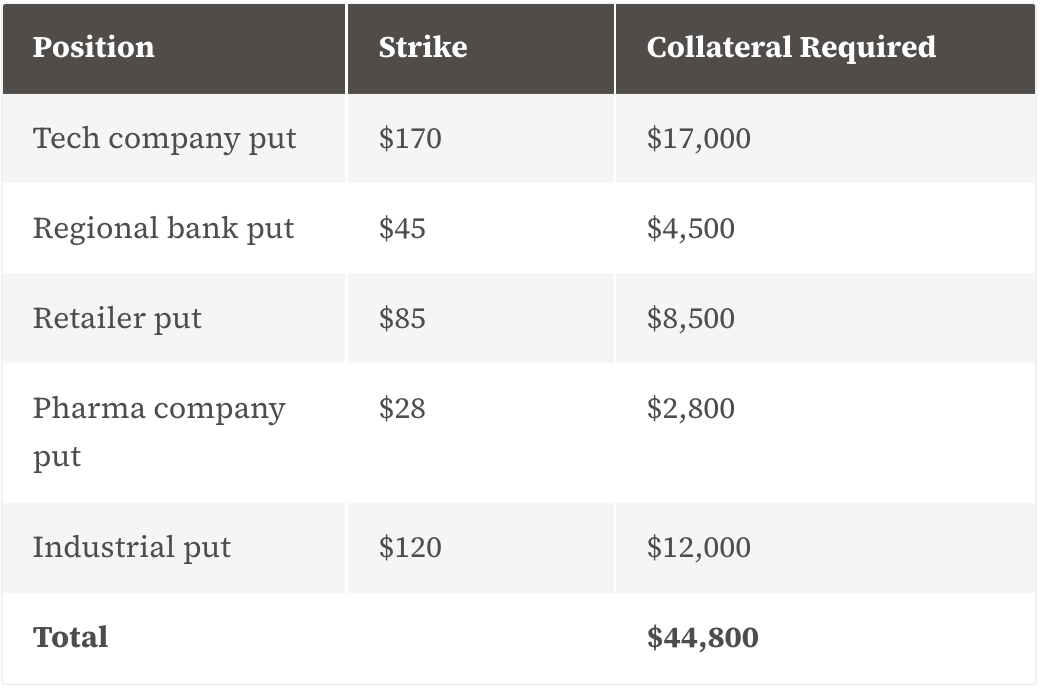
A $100,000 portfolio with $40,000 in cash reserves can cover $44,800 in assignments. Pass.
Change the numbers: $20,000 in cash and $50,000 already held in stock from previous assignments. That’s $70,000 committed. Add the $44,800 and the total hits $114,800 — overextended by the cost of one bad week.
What Failure Looks Like
When simultaneous assignments can’t be covered, the broker forces decisions on the account.
Positions get liquidated to free capital. Usually at the worst prices, during the worst moments. Control of the exit is gone.
Traders who survive market stress aren’t the ones who predicted it. They’re the ones who sized for it before it arrived.
Every time a new position is considered, rerun the test. Add the new collateral requirement to the existing total. If the sum exceeds available capital, the answer is no — regardless of how good the setup looks.
The best trade is sometimes no trade.
Wheel Strategy position sizing rules at a glance
Maximum per position: 5-10% of total portfolio
Active deployment: 50-60% of portfolio
Cash reserves: 20-30% of portfolio
Other holdings: 10-20% of portfolio
Single sector cap: 25% of portfolio
Positions per sector: 2-3 maximum
Minimum sector spread: 3-4 sectors when fully deployed
Stress test: Total collateral across all open puts must be coverable by available cash
Typical active positions: 4-8
Position sizing is the foundation that makes everything else possible.
Strike selection, expiration timing, stock analysis, rolling strategies — all of it operates within the constraints that position sizing establishes.
Get the sizing wrong and perfect execution on everything else still ends in disaster.
These numbers are the boundaries that separate traders who compound wealth over decades from traders who blow up and start over.
The Wheel Strategy works because it’s mechanical. Follow the rules, collect premium, manage positions, repeat. But mechanics only function within proper constraints.
Position sizing sets those constraints.
With them in place, being wrong is survivable. Mistakes become lessons. Losses stay contained. The account stays in the game long enough for compounding to work.
Knowing the Wheel Strategy and running it week after week are different problems.
The paid tier is where the system runs: fifteen setups every Monday with full management plans for every position, a printable PDF, and ten pre-filtered cash-secured puts every trading day.
The full breakdown is on the page below.
